How to recover from the Google’s Panda update and reasons for penalisation
Not just another Panda recovery article without a proof or math
What is Google Panda
The Google Panda is an algorithm that measures user behaviour and reflects it in rankings.
The so-called Panda update took place for the first time back in February 2011, and several tweaks have been applied until it became a regular part of the Google’s ranking algorithm. A long story short, it’s all about satisfying the audience of your webpages; The more happy they are when coming to your website, the more chances for you to occupy top positions of SERP. Bounce rate doesn’t matter.
You may have heard stories in which webmasters keep explaining all those “cleanup” steps such as noindexing certain types of pages, removing tag pages, moving ads from the top of their webpages, reducing bounce rate, etc. All such stories lack at a metric that would explain a recovery from the Panda. Of course, some general cleanup is always welcome, however you never know whether it’s going to lead to a recovery when there’s no metric that could be measured.
The proof
Before the metric and approach are explained, here below is the proof. Two significant drops, which occurred during the first two releases of Panda, in February and April 2011 are easy to identify in the first chart.

And here’s the recovery later in September 2011:

Side note: The drop in August was caused by outage on the server side.
The questions are:
- How to keep a website “Panda-compliant”?
- What’s that metric?
- How to recover from the Google Panda?
Please, note no dramatic changes have been applied in order to recover from the Panda, definitely none of the following:
- Bounce rate change
- Header modification
- Navigation change
It is a misunderstanding that plenty of webmasters offer advice on the Panda recovery without actually knowing anything about relations between the changes they’ve applied and the recovery itself. What could work for them doesn’t have to work for you, bear this in mind!
The idea behind Panda and why user behaviour is being monitored
Google engineers came with an idea of measuring user behaviour as it definitely makes sense that if a website is really related to what a visitor looks for, there is a little chance that visitors leave it in a short time. Two questions come into play in this case:
- How long is “enough” to tell that a visitor is happy with the content?
- How to measure the total time that visitors spend on my webpages?
The answer to the first question is a bit complex, we have to reduce short lasting visits firstly. These do include all visits from organic search that leave in less than 15 seconds. Then we have to reduce organic visits leaving in the first 30 seconds and then we can continue trying to maximise the time spent on a site to say 5 or 6 minutes or even more. But why so?
It simply makes sense that a website of superior quality and relevancy is liked much more than a website with a lack of information, bad navigation, small fonts, ads all over the place. As a visitor, which of those would you prefer?
Let’s define the ideal (or almost ideal) rate of departures in the first two minutes
Once again we run into another question which is “Why just 2 minutes?” The answer is very simple; If your website is capable of attracting attention so a visitor stays there for at least 2 minutes, it means it’s somehow related to a search query and it also provides information that a visitor considers relevant. It also is likely that visitors spend there more time than just 2 minutes even though some percentage will still leave in say 2 minutes and 15 seconds, 2 minutes and 30 seconds, …, 3 minutes, 4 minutes, etc.
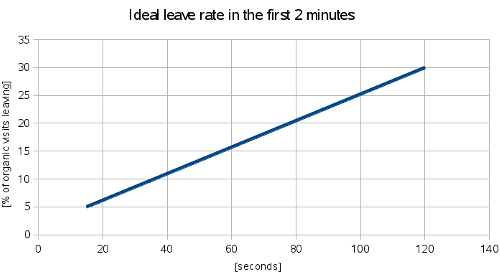
The following chart displays the ideal trend of leaves until the first 120 seconds.

In other words, if just around 5% of organic visits leave in the first 15 seconds, another 5% in the first 30 seconds, it means a website is good enough for 90% of visitors to stay there for at least 30 seconds. Sounds plausible, doesn’t it. And definitely it’s a sign of quality that 70% of organic visits spend at least 2 minutes on a website.
Have you ever wondered how many words is one able to read in 120 seconds? It’s roughly 420 words! Therefore if we’re able to keep a visitor on some page for 120 seconds it means approximately 420 words are being read. Various sources say it’s anything from 200 up to 300 words per minute, however the point of this article is to explain something else.
In the case of your page contains over a thousand words, you’d expect visitors to stay there even 4-5 minutes. That’s the issue with sites such as ehow as the average length of their articles hardly exceeds 1000 words and is rather somewhere near 400 which after all means a visitor is going to spend at most 2 minutes on such a website. The question is “What does a visitor do after those 2 minutes?” Most visitors will click the back button and try another URL from SERP, which could really mean a website doesn’t offer sufficient information to answer the visitors’ questions. Moreover, not all visitors are going to read the whole article but will leave before doing so!
By reducing the leave rate in the first 120 seconds a webmaster should also improve the overall length of visit!
Look at the table below, I had performed lots of research on this back in 2011 and my assumptions are based on following table/results:
| URL | % of visits leaving in 14 seconds | % of visits leaving in 59 seconds | % of visits staying 135+ seconds | Quality links pointing to the URL? | Triggered Panda? |
|---|---|---|---|---|---|
| URL1 | 3,45% | 6,9% | 75,86% | no | NOT |
| URL2 | 10,71% | 26,79% | 53,57% | not many | NOT |
| URL3 | 11,82% | 32,72% | 51,82% | only a few | NOT |
| URL4 | 14,94% | 44,83% | 45,98% | only a few | YES |
| URL5 | 18,00% | 30,25% | 58,95% | yes | YES |
| URL6 | 18,09% | 38,49% | 39,14% | yes | YES |
| URL7 | 18,97% | 38,35% | 41,24% | yes | YES |
| URL8 | 22,82% | 44,08% | 43,40% | not many | YES |
| URL9 | 24,05% | 45,13% | 38,65% | yes | YES |
| URL10 | 39,86% | 66,67% | 13,77% | no | YES |
The pages with the highest leave rate in the first minute have suffered the most and became practically invisible to searchers. No wonder those were mostly MFA (made for ads) pages with really no value to the visitors except for earnings to me.
So: How to recover from the Google Panda?
The following approach should be used when finding out why a website has taken a hit by the Panda:
- Identify pages with the greatest number of visits and low “stay on site” time.
- Identify all pages that bring short lasting visits (less than 2 minutes in average).
- Identify all issues that may be causing short lasting visits. These may include:
- Ads at the top – Visitors don’t like such websites.
- Poor font size, almost transparent font color. Visitors prefer easy-to-read and easy-to-navigate websites.
- Check how your website looks like on a cell phone, tablet, laptop, large screen – You may realise that it all goes wrong on a cell phone display while a large screen offers a superb show. Nowadays lots of people use tablets and small mobile phones to access the internet which means a web design is no more about fixed widths.
- The most important content is hidden somewhere below the fold. Most internet users are lazy people who don’t like scrolling. The worst scrolling they may encounter is a vertical one.
- Content – Imagine you’re a visitor, would you really like your website to be shown within SERP?
- Are the title tag, meta description and content really related to search queries that produce short lasting visits?
The primary goal when dealing with the Panda is to improve the total average length of visit to at least 4 minutes. Please, bear in mind:
- A website with the average length of visit of 2 minutes usually isn’t of sufficient quality in order to occupy top positions of search results.
- Traffic of a website that has the average length of visit reaching at most a minute will suffer from this algorithmic penalisation until further improvements are made by a webmaster.
- A website with the average length of visit of 30 seconds is an ideal candidate for a rebuild.
How to measure the average length of a visit and how to identify poor quality pages?
There’s an application called TOP which is located here. The only purpose of the TOP application is to help webmasters understand the traffic of their websites and to help them build a better web. Google Analytics doesn’t give you sufficient information regarding the length of a visit as they only track traffic until last click which in fact means that a 10 minute long visit with no click on an internal link will appear as a zero-second visit. In the end you may focus on rebuild of inappropriate pages.
With TOP you get automated reports and analysis of pages and search terms that produce poor traffic.
Happy recovery ☺ .
Footnote
Please, bear in mind websites may be categorised and the final decision whether an algorithmic penalty is going to be applied or not may depend on this categorisation and also on the power of inbound links. However the point of Panda is simple; To demote websites with poor user satisfaction. Every webmaster should focus on improving usability and user happiness as they guarantee much more than another “plus” in the algorithm. Instead, when people like a website, they link to it. One can get more backlinks, more traffic from social media, etc.


